Are you truly in control of your Shopify store’s performance, or are you just guessing?
Many store owners rely on surface-level data like total sales or traffic spikes but don’t fully understand why those numbers rise or fall. That’s where advanced analytics comes in.
While Shopify’s built-in reports offer a decent overview, they often fall short when it comes to providing deep, actionable insights. If you want to uncover what’s really driving your conversions, retention, and marketing ROI, you’ll need to go beyond the basics.
In this Article, we’ll walk you through how to set up advanced analytics for your Shopify store covering the essential tools, key metrics to track, and how to translate raw data into meaningful business decisions. Whether you’re aiming to boost sales, optimize marketing, or simply understand your customers better, this guide is your first step toward smarter eCommerce growth.
Table of Contents
ToggleWhy Advanced Analytics Matter for Shopify Stores
The Limitations of Default Shopify Analytics
Shopify provides a solid foundation for tracking your store’s performance, especially if you’re on a higher-tier plan. You can view metrics like total sales, top products, traffic sources, and basic customer behavior. However, these out-of-the-box reports only scratch the surface.
They don’t answer deeper questions like:
- Why are certain products converting better than others?
- Where exactly are users dropping off in your checkout flow?
- Which marketing campaign brought in the most valuable customers, not just the most clicks?
For store owners looking to scale, relying solely on Shopify’s built-in reports can lead to missed opportunities and blind spots in decision-making.
The Power of Actionable Data in Decision-Making
Advanced analytics isn’t just about collecting more data, it’s about collecting the right data and knowing what to do with it. With tools like Google Analytics 4, Google Tag Manager, and heatmapping software, you can go beyond vanity metrics and start tracking real performance indicators like:
- User paths and conversion funnels
- Abandoned cart triggers
- Lifetime customer value by source or campaign
- Micro-interactions (e.g., video views, filter clicks)
These insights give you the power to make confident, data-driven decisions instead of relying on assumptions or guesswork.
How Analytics Help Improve Conversions, Marketing ROI, and User Experience
Once you set up advanced analytics, the impact can be efficient. Here’s how:
- Higher Conversion Rates: By understanding where users drop off, you can fix friction points in your checkout flow or landing pages.
- Smarter Marketing Spend: Advanced tracking reveals which campaigns bring in high-value customers, not just the most traffic helping you focus your budget where it counts.
- Improved User Experience: Heatmaps and behavior data show how users interact with your store, so you can redesign or optimize key pages for usability.
In short, advanced analytics transform your store from a passive sales platform into a smart, data-informed growth engine.
Tools You Need to Track Advanced Metrics
To go beyond basic reporting and unlock deep, actionable insights, you need more than just Shopify’s default dashboard. Below are the essential tools every data-driven Shopify merchant should consider integrating into their analytics stack:
Google Analytics 4 (GA4): Enhanced eCommerce Tracking
GA4 is the gold standard for tracking user behavior across your entire store. Unlike Universal Analytics, GA4 focuses on events and user engagement, offering much richer insights into how visitors interact with your site.
With GA4, you can:
- Track the full customer journey (from first visit to purchase)
- Measure detailed eCommerce metrics like product views, add to cart events, and checkout steps
- Analyze traffic sources, retention, and lifetime value
Pro tip: Enable Enhanced eCommerce in GA4 to get access to in-depth purchase funnels and product-level performance.
Shopify Analytics & Reports: What You Get by Plan
Shopify provides built-in analytics, but the depth of reporting depends on your plan:
- Basic Shopify: Offers limited sales and traffic data
- Shopify Plan: Includes professional reports and customer behavior analytics
- Advanced Shopify & Plus: Unlock custom reports and detailed insights into margins, acquisition, and more
While useful, these reports often lack customization and don’t provide multi-touch attribution or advanced funnel analysis which is why integrating external tools is so important.
Hotjar / Microsoft Clarity: Behavior Tracking and Heatmaps
Numbers tell you what’s happening tools like Hotjar and Clarity show you why.
These behavior analytics tools let you:
- Visualize how users interact with your site through heatmaps
- Replay individual session recordings to identify usability issues
- Collect feedback through on-site polls or surveys
If you’re redesigning your product pages, checkout flow, or homepage, these tools are essential for understanding what works and what doesn’t.
Facebook Pixel / TikTok Pixel: For Ad Campaign Optimization
If you’re running paid social ads, installing a Facebook or TikTok Pixel is non-negotiable. These tracking tools help platforms learn from user behavior on your store and optimize your ad delivery accordingly.
With these pixels, you can:
- Track events like purchases, add to cart, and page views
- Build powerful retargeting audiences
- Measure campaign ROI and attribution beyond just last-click
Make sure these pixels are installed and firing correctly especially during key promotions or launches.
Google Tag Manager: Streamlining Tracking Without Code Edits
Google Tag Manager (GTM) is a must-have for managing all your tracking scripts in one place. Instead of editing your Shopify theme code every time you want to add a tag, GTM lets you do it from a single interface.
With GTM, you can:
- Deploy and manage GA4, ad pixels, Hotjar, and custom event tracking
- Create triggers for specific user actions (e.g., newsletter signups, product views)
- Test and debug tags before they go live
It’s a powerful tool for marketers and developers alike, especially when scaling your analytics efforts.
Together, these tools form the foundation of a robust analytics ecosystem that helps you monitor, optimize, and grow your Shopify store with precision.
Setting Up Google Analytics 4 (GA4) for Shopify
Google Analytics 4 (GA4) gives you advanced insight into how users engage with your Shopify store from product views to purchases. But to get the most value, it’s important to set it up correctly from the start.
Here’s how to do it:
Step-by-Step Guide to Integrate GA4 with Shopify
Create a GA4 Property
- Go to your Google Analytics account.
- Click “Admin” → “Create Property” → Choose GA4.
- Enter your store name, time zone, and currency, then click Next and set up the property.
Set Up a Data Stream
- Select Web as the platform.
- Enter your Shopify store URL (e.g., yourstore.com).
- Click “Create Stream” to get your Measurement ID (starts with G-).
Add GA4 to Shopify
- From your Shopify admin, go to Online Store > Themes.
- Click Actions > Edit Code.
Open the theme.liquid file and paste the GA4 global site tag (gtag.js) just before the closing </head> tag.
html
<!– Global site tag (gtag.js) – Google Analytics –>
<script async src=”https://www.googletagmanager.com/gtag/js?id=G-XXXXXXX”></script>
<script>
window.dataLayer = window.dataLayer || [];
function gtag(){dataLayer.push(arguments);}
gtag(‘js’, new Date());
gtag(‘config’, ‘G-XXXXXXX’);
</script>
- Replace G-XXXXXXX with your actual GA4 Measurement ID. Save the file.
Setting Up Enhanced eCommerce Tracking
Shopify doesn’t natively support Enhanced eCommerce for GA4, but you can implement it manually or with Google Tag Manager (recommended).
Option 1: Manual Setup (Basic Tracking Only)
- You can manually track page views and purchases via the checkout scripts (Shopify Plus) or thank-you page.
Option 2: Google Tag Manager (Advanced Setup)
- Install GTM on your site and configure tags for:
- Product views
- Add to cart
- Begin checkout
- Purchase
- Use Shopify’s dataLayer events or custom JavaScript triggers to send eCommerce data to GA4.
Recommended Apps
If you prefer a no-code approach, use apps like:
- Elevar: Automatically maps eCommerce events to GA4.
- Littledata: Seamless GA4 integration for Shopify.
Verifying Proper Data Collection
To make sure GA4 is tracking data correctly, use:
- DebugView in GA4
- Go to “Admin > DebugView” in GA4.
- Use Google Tag Assistant or enable preview mode in GTM to test your tracking setup.
- Real-Time Reports
- Check “Reports > Real-Time” to see if page views, events, and conversions are being registered as you browse your site.
Common Setup Issues and How to Fix Them
Issue | Cause | Fix |
No data showing in GA4 | Missing or incorrect tag | Verify your GA4 Measurement ID and make sure the tag is placed correctly in theme.liquid |
Events not firing (add to cart, purchase, etc.) | GTM not installed or misconfigured | Use GTM preview mode and check trigger conditions; ensure Shopify’s dataLayer is available |
Duplicate tracking | Using both Shopify’s built-in GA + custom GA4 tags | Use only one GA tracking setup to avoid double-counting |
Checkout data missing | Shopify checkout pages don’t support custom scripts (unless on Plus) | Use server-side tracking or Shopify Plus scripts, or integrate via Shopify’s checkout.liquid (Plus only) |
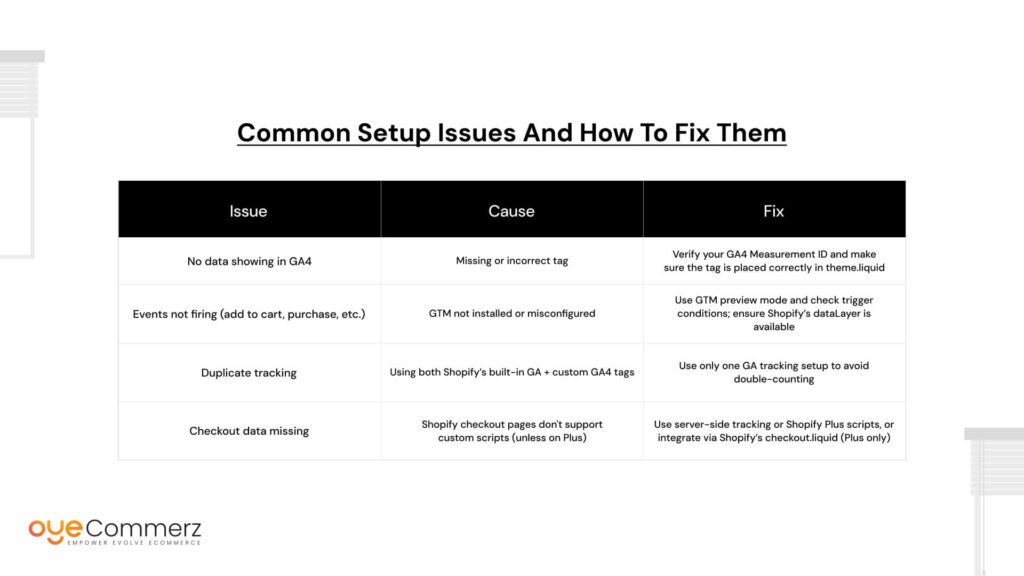
Setting up GA4 might seem technical, but once configured properly, it opens the door to a world of actionable insights that can significantly boost your store’s performance.
Using Google Tag Manager (GTM) for Custom Events
Why GTM Is Important for Advanced Tracking
Google Tag Manager (GTM) acts as a control center for all your marketing and analytics scripts without the need to constantly update your Shopify theme code. For Shopify store owners aiming to go beyond basic tracking, GTM is a must-have.
With GTM, you can:
- Deploy multiple tracking tools (GA4, Facebook Pixel, Hotjar, etc.) from one place
- Create custom event tracking without a developer
- Update, test, and debug tags in real-time without editing your store’s backend
GTM is especially useful when you want to track micro-conversions like clicks, form submissions, or video views things that Shopify and GA4 don’t automatically capture.
Installing GTM on Your Shopify Store
Create a GTM Account
- Go to tagmanager.google.com, sign in, and create a new account.
- Choose the Web as the target platform.
- Copy your Container ID (e.g., GTM-XXXXXXX).
Add GTM to Your Shopify Theme
- In Shopify Admin, go to Online Store > Themes > Edit Code.
- Open theme.liquid, then:
- Paste the GTM container <script> tag right after the opening <head> tag
- Paste the <noscript> tag immediately after the opening <body> tag
- Save the changes.
Tip: Always publish changes in GTM only after testing in Preview mode to ensure accuracy.
Creating Custom Tags for Key Events
Once GTM is installed, you can start setting up custom event tags to track specific user actions. Here are some important ones:
1. Add to Cart
Trigger: Click on the “Add to Cart” button
- Use GTM’s Click Classes or Click Text trigger
- Create a GA4 Event Tag with event name add_to_cart
javascript
gtag(‘event’, ‘add_to_cart’, {
currency: ‘USD’,
value: 29.99,
items: [{
item_id: ‘SKU_123’,
item_name: ‘Product Name’,
quantity: 1
}]
});
2. Begin Checkout
Trigger: When a user clicks the “Checkout” button
- Similar setup using click triggers or page path (/checkout)
Event name: begin_checkout
3. Purchase
Trigger: Thank You page view
- Set trigger for page URL that contains /thank_you
- Fire a tag with event name purchase
Add dynamic values like order total and transaction ID using Shopify’s checkout.liquid variables (Shopify Plus) or with apps like Elevar/Littledata for non-Plus users.
4. Newsletter Signups
Trigger: Form submission or button click
- Choose Form Submission or Click Trigger
- Event name: generate_lead or sign_up
Optional: Add form ID or confirmation text to ensure accurate tracking.
5. Video Views (If Applicable)
If you embed videos on your site (e.g., YouTube), GTM can track video interactions.
- Use YouTube Video trigger in GTM
- Track events like video_start, video_progress, video_complete
Testing Your Tags
Before publishing:
- Use Preview Mode in GTM to simulate actions and ensure tags fire correctly
- Check GA4 DebugView to confirm events are received and processed
By using GTM for event tracking, you unlock a deeper understanding of user behavior and gain the flexibility to measure nearly any interaction without relying on developer support for every change.
Must-Track Metrics to Evaluate Store Performance
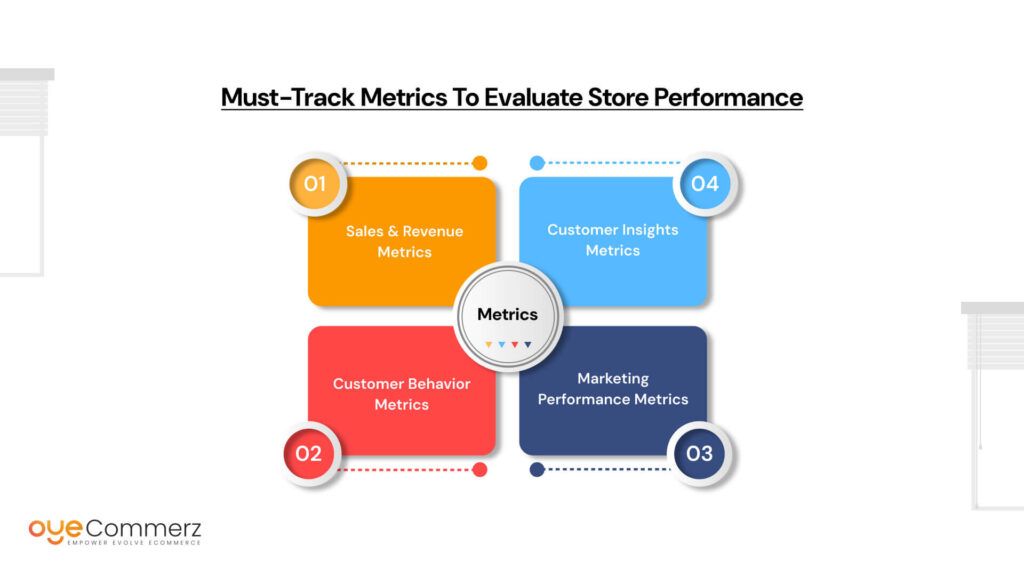
Tracking data is only valuable when it drives smart decisions. To understand how your Shopify store is truly performing, you need to monitor the right metrics ones that go beyond surface-level stats and provide real insights into revenue, customer behavior, and marketing efficiency.
Here’s a breakdown of must-track metrics, organized by category:
a. Sales & Revenue Metrics
These KPIs help you understand your store’s financial performance and sales trends.
- Conversion Rate
Percentage of visitors who complete a purchase.
Why it matters: A key indicator of how well your store turns interest into revenue.
Formula: (Total Orders ÷ Total Visitors) × 100 - Average Order Value (AOV)
The average amount spent per transaction.
Why it matters: Higher AOV means more revenue without more traffic.
Formula: Total Revenue ÷ Number of Orders - Revenue by Channel
Breakdown of earnings from sources like organic search, paid ads, email, or social.
Why it matters: Helps you double down on high-performing channels and cut waste from underperformers.
b. Customer Behavior Metrics
These metrics reveal how users interact with your store and where they drop off.
- Bounce Rate
Percentage of visitors who leave after viewing only one page.
High bounce rate? Your landing page might not be relevant or engaging. - Session Duration
Average time users spend on your store.
Longer sessions often signal higher engagement and stronger purchase intent. - Cart Abandonment Rate
Percentage of users who add items to their cart but don’t complete the purchase.
Crucial for identifying friction in your checkout process.
Formula: [(Carts – Completed Orders) ÷ Carts] × 100 - Funnel Drop-Offs
Shows where users leave in the purchase journey (e.g., product > cart > checkout > thank-you).
Visualized through tools like GA4 funnels or Hotjar session recordings.
c. Marketing Performance Metrics
These KPIs assess the efficiency of your traffic sources and campaigns.
- Traffic Sources (Paid, Organic, Referral, Direct, etc.)
Where your visitors are coming from.
Helps allocate your marketing budget wisely. - ROAS (Return on Ad Spend)
Revenue earned for every dollar spent on ads.
Formula: Revenue from Ads ÷ Ad Spend
A must-track for Facebook, Google, TikTok, and influencer campaigns. - Email Campaign Performance
Metrics include open rate, click-through rate (CTR), and conversions.
Helps fine-tune subject lines, content, and timing.
d. Customer Insights Metrics
These metrics tell you how valuable and loyal your customers are over time.
- Customer Lifetime Value (CLV)
Estimated revenue a customer generates over their entire relationship with your brand.
Formula: AOV × Purchase Frequency × Customer Lifespan
A high CLV justifies investing more in acquisition and retention. - Repeat Purchase Rate
Percentage of customers who come back to buy again.
Formula: (Repeat Customers ÷ Total Customers) × 100
A key health metric for brand loyalty. - Cohort Analysis
Tracks how different groups (by signup month, campaign, etc.) behave over time.
Reveals long-term trends in retention, purchase frequency, and churn.
By regularly monitoring these metrics, you can spot opportunities, fix leaks in your sales funnel, and measure the real ROI of your efforts. Set up dashboards in GA4 or third-party tools like Triple Whale, Glew, or Looker Studio to visualize this data in one place.
Creating Custom Dashboards for Real Time Monitoring
Tracking metrics is only half the battle. To make data truly useful, you need a centralized, real-time dashboard that lets you see your store’s performance at a glance without logging into multiple platforms.
That’s where tools like Google Looker Studio (formerly Data Studio) come in.
Google Looker Studio: A Powerful Visualization Tool
Google Looker Studio is a free dashboard tool that helps you:
- Visualize complex eCommerce data with charts, graphs, and tables
- Connect multiple data sources (GA4, Shopify, Meta Ads, etc.)
- Share real-time reports with your team or clients
- Customize reports to focus on KPIs that matter most to your Shopify business
Integrating Looker Studio with GA4, Shopify & Other Tools
To build a meaningful dashboard, you need to connect Looker Studio with your data pipelines:
Connect GA4 (Google Analytics 4)
- Native connector available in Looker Studio
- Track traffic sources, user behavior, conversion paths, and events
Connect Shopify
Since Shopify doesn’t have a native Looker Studio connector, use:
- Third-party connectors like Supermetrics, Power My Analytics, or ReportDash
- Google Sheets Export: Use Shopify reports or apps like EZ Exporter to push data into Google Sheets, then connect Sheets to Looker Studio
Other Integrations
- Meta Ads, TikTok Ads, Google Ads: Use their native connectors
- Hotjar / Microsoft Clarity: Export session or heatmap summaries into Sheets for custom visualization
- Google Tag Manager Events: Events pushed via GA4 can be visualized in Looker Studio
Dashboard Examples: What You Should Track
Below are four core dashboards you can build for real-time monitoring, tailored to Shopify store needs:
1. Sales Performance Dashboard
Key Metrics:
- Total sales and net revenue
- Conversion rate by device
- AOV (Average Order Value)
- Sales by day/week/month
- Top-selling products
Purpose:
Get an instant snapshot of how your store is performing financially and identify trends over time.
2. Product Performance Dashboard
Key Metrics:
- Product views vs. purchases
- Top and bottom-selling products
- Revenue per product
- Return/refund rates (if tracked)
- Inventory alerts (via Shopify Sheets export)
Purpose:
Spot bestsellers, underperforming items, and opportunities to upsell or bundle products.
3. Marketing Attribution Dashboard
Key Metrics:
- Revenue by source/medium (organic, paid, email, referral)
- ROAS (Return on Ad Spend)
- New vs. returning customer acquisition cost
- Campaign performance breakdown (UTM tracking)
- Email click-to-conversion rate
Purpose:
See which channels are driving revenue and make better budget decisions across ad platforms.
4. User Journey & Heatmap Insights
Key Metrics:
- Funnel drop-offs (e.g., homepage > product > cart > checkout)
- Pages with high exit/bounce rates
- Session duration per page type
- Scroll depth and click data (exported from Hotjar/Clarity)
- Form submission/drop-off analytics
Purpose:
Understand how users navigate your store and where they lose interest, so you can optimize UX and boost conversions.
Pro Tip: Automate Reporting & Alerts
- Schedule automatic email reports to be sent weekly/monthly
- Use conditional formatting or thresholds to flag critical drops (e.g., <1% conversion rate, spike in cart abandonment)
Creating real-time dashboards in Looker Studio turns raw data into visual stories that empower your team to make data-backed decisions daily without guesswork.
Actionable Analytics: How to Turn Insights Into Growth
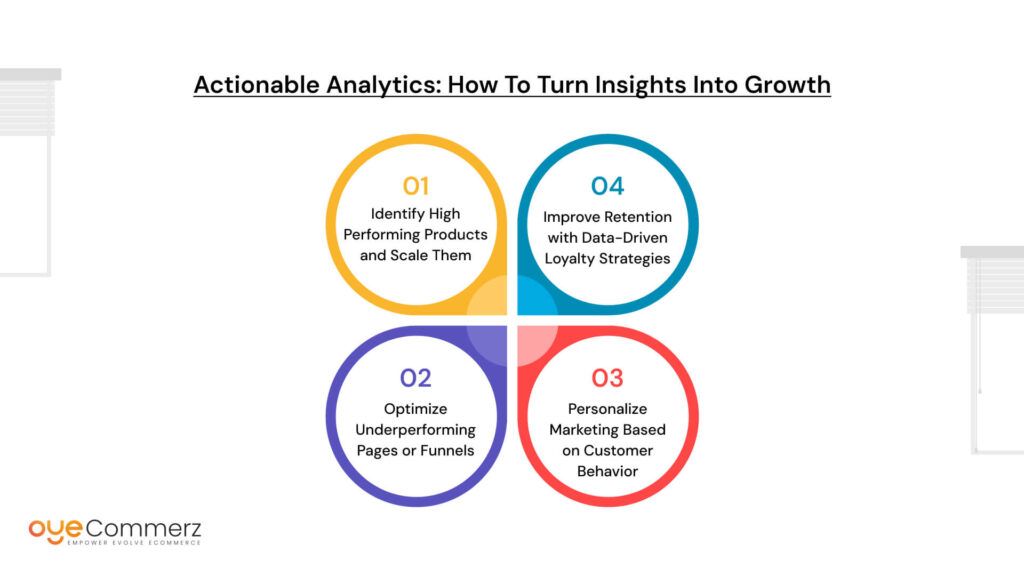
Collecting analytics is only the first step. The real value lies in interpreting that data and using it to improve decision-making, enhance user experience, and drive business growth.
Below are four key ways to translate your insights into strategic actions that help your Shopify store thrive.
1. Identify High Performing Products and Scale Them
What to look for:
- High conversion rates
- High revenue per product
- Strong and consistent performance across marketing channels
Actions to take:
- Increase visibility by featuring top products on your homepage and collections
- Scale advertising campaigns focused on these products
- Bundle them with complementary items to increase average order value
- Create targeted campaigns based on the audience segments that buy them
Example:
If a product has a 9% conversion rate and performs best on Instagram Ads, increase the budget on that platform and expand your targeting using lookalike audiences.
2. Optimize Underperforming Pages or Funnels
What to look for:
- High bounce or exit rates
- Drop-offs in the checkout funnel (e.g., cart to checkout, checkout to purchase)
- Low engagement metrics like session duration or scroll depth
Actions to take:
- Test new product images, descriptions, headlines, and call-to-action buttons
- Add customer reviews, trust badges, and clear return policies
- Reduce friction in the checkout process (fewer fields, guest checkout)
- Use behavior tracking tools (e.g., Hotjar or Microsoft Clarity) to understand user hesitations
Example:
If users drop off at the shipping page, consider simplifying shipping options or offering clearer delivery timelines.
3. Personalize Marketing Based on Customer Behavior
What to look for:
- Browsing and purchase history
- Abandoned cart activity
- Frequency and timing of visits
- Email engagement data
Actions to take:
- Send behavior-based email flows such as cart recovery or product interest reminders
- Use retargeting ads to bring back visitors who showed intent but didn’t convert
- Personalize product recommendations on-site and in email campaigns
- Segment your audience by behavior to improve email and ad relevance
Example:
If a group of visitors frequently views a category (e.g., winter jackets) but never purchases, send them a limited-time offer or style guide to re-engage them.
4. Improve Retention with Data-Driven Loyalty Strategies
What to look for:
- Customer lifetime value (CLV)
- Time between purchases
- Repeat purchase rate
- Cohort behavior over time
Actions to take:
- Launch loyalty programs that reward repeat purchases
- Use win-back email campaigns triggered by inactivity
- Offer subscription options for products that require regular restocking
- Identify the characteristics of high-CLV customers and tailor marketing to attract more like them
Example:
If a cohort of first-time buyers in January had a high repeat rate due to a welcome email series, replicate and scale that series across future cohorts.
When to Hire an Expert or Use a Shopify Analytics App
As your Shopify store grows, tracking analytics can become increasingly complex. Knowing when to bring in an expert or leverage dedicated analytics apps can save you time, reduce errors, and unlock deeper insights.
When to Consider Hiring an Analytics Expert
- Your store is scaling rapidly
As order volume and traffic increase, basic analytics setups may no longer provide accurate or actionable insights. An expert can audit your existing setup, ensure data accuracy, and customize tracking for complex scenarios such as multiple product lines or international markets. - You need advanced cross-platform attribution
If your marketing spans multiple channels (e.g., Google Ads, Facebook, TikTok, email) and devices, understanding how each touchpoint contributes to sales becomes critical. An expert can implement sophisticated attribution models and unify data sources for a comprehensive view. - You require custom tracking or integrations
When your store’s tracking needs extend beyond standard events such as tracking custom user behaviors, offline conversions, or integrating third-party CRMs specialized expertise is essential.
When to Use Shopify Analytics Apps
Analytics apps can simplify setup, automate reporting, and fill gaps in Shopify’s native analytics. Consider apps when you want:
- Easier installation of advanced tracking without coding
- Enhanced eCommerce tracking with pre-built GA4 and Facebook Pixel integrations
- Automated dashboards and visualizations tailored for Shopify merchants
- Deeper product, marketing, and customer insights with minimal manual setup
Recommended Shopify Analytics Apps
- Littledata
Offers enhanced eCommerce tracking for GA4 and Facebook Pixel, ensuring data accuracy and reliable attribution for Shopify stores. - Elevar
A robust tool for managing tags, tracking events, and integrating multiple analytics platforms with Shopify. - Peel Insights
Provides easy-to-understand dashboards focused on customer behavior, product performance, and marketing effectiveness.
Ready to Unlock Your Shopify Store’s Full Potential?
Need help setting up advanced analytics for your Shopify store?
Partner with Oyecommerz for custom Shopify analytics solutions and data-driven growth strategies that drive real results.
Get in touch today and start turning your data into growth!
Contact to Migrate your Site to Shopify Now
Conclusion
Advanced analytics play a crucial role in unlocking the full potential of your Shopify store. While Shopify’s built-in tools offer a good starting point, they often fall short when it comes to deep insights and data-driven decision-making. By setting up advanced tracking, using powerful tools like Google Analytics 4 and Google Tag Manager, and creating custom dashboards, you can gain a comprehensive understanding of your customers, sales, and marketing effectiveness.
Remember, you don’t need to implement everything at once. Start small by tracking a few key metrics and gradually expand your analytics as your store grows and your needs become more complex. This approach ensures you build a solid foundation and avoid overwhelm.
Taking control of your data empowers you to optimize every aspect of your Shopify store, drive higher conversions, and scale your business with confidence.
Frequently Asked Questions
To set up Google Tag Manager (GTM) on Shopify:
Create a GTM account at tagmanager.google.com.
Copy your GTM container code.
In your Shopify admin, go to Online Store > Themes > Edit Code.
Paste the GTM
<head>
code into thetheme.liquid
file, right before the closing<head>
tag.Paste the GTM
<noscript>
code after the opening<body>
tag.Save the changes and publish your theme.
Use the Preview mode in GTM or Chrome extensions like Tag Assistant to verify installation.
For advanced event tracking (e.g., Add to Cart, Purchase), set up triggers and variables in GTM or use a plugin like Elevar for Shopify-compatible templates.
To improve your Shopify store’s performance:
Optimize site speed:
Compress images and use next-gen formats (like WebP).
Minimize JavaScript and CSS.
Use a fast, lightweight theme.
Avoid unnecessary apps that slow down the site.
Improve conversions:
Use heatmaps and A/B testing to refine UX.
Simplify checkout and navigation.
Highlight trust signals like reviews and guarantees.
Enhance analytics and personalization:
Track key metrics and user behavior to make informed changes.
Personalize emails and on-site content based on customer data.
Focus on mobile performance, as most Shopify traffic is mobile-first.
To set up basic and advanced tracking on Shopify:
Shopify Analytics: Enabled by default and provides dashboards based on your Shopify plan.
Google Analytics 4 (GA4):
Set up a GA4 property.
Paste the GA4 measurement ID into Online Store > Preferences > Google Analytics (use the “custom pixel” method if Shopify no longer supports GA4 directly).
Use Google Tag Manager for enhanced tracking events.
Facebook Pixel / TikTok Pixel:
Install via respective apps or through GTM.
Track custom events like Add to Cart, Purchase, etc.
Use apps like Littledata or Elevar for advanced tracking templates and easier setup.
To access Shopify’s built-in analytics:
Go to your Shopify admin dashboard.
Click “Analytics” in the left sidebar.
Use the Overview dashboard to view key metrics like total sales, sessions, conversion rates, and top products.
Navigate to “Reports” for detailed metrics on sales, behavior, customers, and marketing.
Note: The level of detail you can access depends on your Shopify plan. For example, Basic plans have limited reports, while Advanced and Shopify Plus plans offer more in-depth analytics and custom reports